What Triggers Google AI Overviews? What the Research Shows
Which queries trigger AI Overviews and which do not, according to the published research, plus what Google itself says about when they appear.
 ChatGPT
 Claude
 Perplexity
 Grok
GrokOn this page
Query shape decides. Question-shaped, informational searches trigger Google AI Overviews far more often than short or transactional ones, and the gap is large: in the biggest published study, informational queries returned an AI Overview 36% of the time against 5% for transactional queries. Google's own position is that Overviews appear only when its systems judge them additive to classic Search, which is why so many commercial queries still return plain links.
This page collects what the published research actually shows, with each study's scope attached. We have no first-party dataset on Overview triggering, so nothing here is ours; every figure links to its source. If you want the block itself explained first, what a Google AI Overview is covers the anatomy before the trigger question.
What the studies found
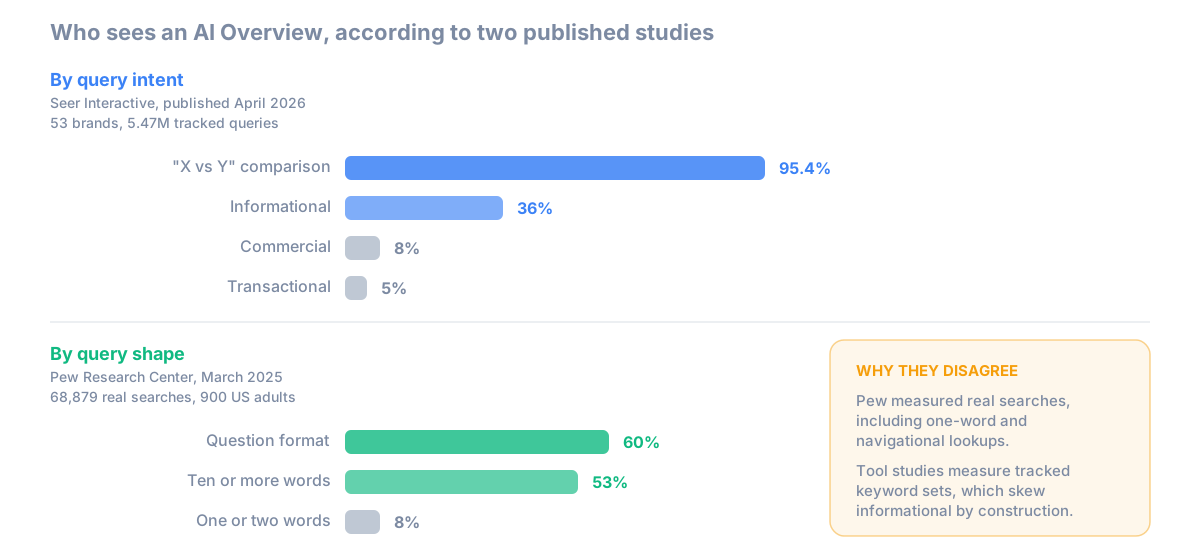
By intent. Seer Interactive's analysis, published April 2026 and covering 53 brands, 5.47 million tracked queries and 2.43 billion organic impressions from January 2025 to February 2026, reports informational queries returning an Overview 36% of the time, commercial queries 8%, and transactional queries 5%. That is roughly a sevenfold gap between the top and bottom of the funnel.
By query shape. Pew Research Center's browsing study tracked 68,879 real Google searches by 900 US adults in March 2025 and found 18% of all searches produced a summary. Within that, question-format queries triggered one 60% of the time, full-sentence searches 36%, searches of ten or more words 53%, and one-to-two-word searches just 8%.
The highest-risk category. Seer's most striking single figure sits inside the informational bucket: comparison queries in the "X vs Y" format returned an Overview 95.4% of the time. If your category is decided by comparison research, effectively every one of those searches is now answered above the links.
Why the headline numbers disagree
You will see AI Overview coverage quoted anywhere between 18% and roughly half of all searches, and the spread is not because someone is wrong. It is because the studies measure different populations.
Pew measured real searches by real people, including navigational lookups, brand names, and one-word queries, which is a query mix weighted toward the things Overviews rarely trigger on. Tool-based studies measure tracked keyword sets, which are assembled by SEO teams and therefore skew heavily toward the informational, question-shaped keywords that trigger Overviews most.
Neither figure is the truth about your site. The only number that matters is the trigger rate across the queries you actually care about, which is why the audit in the next section beats any published average.
Two more scope cautions. The Pew data describes March 2025 and Overviews have expanded since, so treat it as a snapshot of behaviour rather than of current coverage. And Seer's dataset is a client roster of 53 brands, not a census of the web.
The finding that surprises people
Commercial and transactional queries trigger Overviews less than informational ones, not more. The panic narrative has it backwards.
The reconciliation with the Pew figures is worth being precise about, because the two look contradictory at first glance and are not. A buyer typing "what's the best CRM for a ten-person agency" is asking an informational question in a commercial context. It is question-shaped, ten words long, and comparison-flavoured, so it sits in the buckets with the highest trigger rates. A buyer typing "salesforce pricing" or "buy hubspot" is transactional, short, and sits in the 5% bucket.
So the exposure is concentrated at the research stage, not the purchase stage. That is arguably worse for brands rather than better, because the research stage is where shortlists get formed, and it is the part of the funnel most brands measure least. It also means that a keyword mix weighted toward bottom-funnel terms will look reassuringly untouched while the consideration set is being decided elsewhere.
What Google says
Google's documentation on AI features is unusually blunt about triggering: Overviews "are only shown when our systems determine that it is additive to classic Search, and as such, often don't trigger."
On eligibility, the requirement is ordinary indexability. A page must be indexed and eligible to be shown with a snippet, meeting the standard technical requirements, and Google states there are no additional technical requirements and no special optimizations necessary.
On control, there is no dedicated opt-out. The existing snippet controls apply: nosnippet, data-nosnippet, max-snippet, and noindex. Using them to stay out of Overviews also removes you from the snippets and results those directives govern, which is a trade almost nobody should take.
Read together, Google's position is that triggering is a quality judgement it makes per query, not a lever you pull. That is consistent with what the trigger data shows, and it is the reason "how to trigger an AI Overview" is the wrong question.
Auditing your own exposure
The useful version of this analysis takes an afternoon and uses your queries rather than anyone's averages.
- Pull your top 100 queries from Search Console by impressions.
- Classify each one as informational, commercial, or transactional, and separately flag question-format and comparison-format queries.
- Check a sample manually in a signed-out browser, since Overview presence varies by market and over time.
- Weight by impressions, not by count. Ten high-volume comparison queries matter more than sixty long-tail transactional ones.
- Split the result into "answered above the links" and "still a blue-links page".
The first bucket is where AI visibility work pays. The second is where classic SEO still owns the outcome, and it is usually larger than the discourse suggests.
Being cited inside one is a different question
Triggering and citation are separate problems, and only the second is yours to influence.
Whether an Overview appears is Google's call, made per query. Which sources it cites is downstream of ordinary retrieval: pages that are indexed, structurally extractable, and directly answer the question. The Pew data recorded a median summary length of 67 words with 88% citing three or more sources, which tells you the shape of what gets used, namely short, self-contained passages, and that there are only a few slots per answer.
The practical work is covered in optimizing for AI Overviews and AI Mode and, at the page level, in AEO website structure. Tracking presence and citation slots over time is a tooling question, covered in AI Overviews trackers.
What this changes about SEO
Three consequences follow from the trigger data, and none of them is "SEO is dead".
Your informational content is the exposed surface. Guides, definitions, and comparisons are the pages most likely to be summarised above the links, so their traffic assumptions need revisiting even where rankings hold. The CTR impact is quantified in our statistics roundup.
Comparison pages became strategic rather than optional. At a 95.4% trigger rate on "X vs Y" informational queries, the comparison surface is where category recommendations now get formed, whether or not you have a page there.
Transactional pages are the least disrupted. The bottom of the funnel still behaves largely as it did, which is worth saying out loud in a market that has been told otherwise.
The strategic response is not to chase triggering. It is to accept that the research stage is answered on the results page now, and to make sure your brand is inside those answers. What that programme looks like end to end is how to do AEO, and the metrics for judging it are in what is AI visibility. If you want your own Overview presence sampled weekly rather than spot-checked, that is what our Google AI Overview tracker does.