AI Search Statistics 2026: Usage, AI Overviews and SEO Impact
The published numbers behind AI search: chatbot adoption, AI Overview trigger rates, zero-click and CTR impact, and citation data. Every source linked and dated.
 ChatGPT
 Claude
 Perplexity
 Grok
GrokOn this page
- Zero-click search
- How often AI summaries appear, and what triggers them
- Trigger rates by query intent
- What AI summaries do to clicks
- Who AI summaries cite
- Adoption: who is actually using AI chatbots
- The volume shift
- The research that started GEO
- What 200 buyer prompts actually returned: our own study
- How to read these numbers honestly
- Using these statistics
- Turn the trend into your own numbers
The AI search shift is measurable, and the strongest numbers come from independent research rather than tool vendors. This page collects the statistics we consider load-bearing for planning, with a linked primary source and a stated scope for every one. Last verified August 2026.
Three headline facts frame everything else: most Google searches now end without a click, AI Overviews cut click-through roughly in half when they appear, and half of US adults now use AI chatbots, with information lookup as their single most common use.
Jump to: Zero-click · Trigger rates · Trigger rates by intent · Click impact · Who gets cited · Adoption · Volume shift · The GEO research · Our own study · How to read these
Every section heading is linkable, so you can cite an individual statistic rather than the page. If you use one, please cite the primary source alongside us; each is linked inline.
Zero-click search
- Fewer than one third of US Google searches result in a click to the open web. SparkToro's analysis of Similarweb clickstream data found 68% of searches ended zero-click in early 2026, continuing a multi-year climb. Industry-level AI referral traffic benchmarks put that number next to the visits assistants do send.
- The zero-click share grows precisely where AI answers appear, because a sufficient answer removes the reason to click.
The strategic reading: visibility and traffic have decoupled. A brand can shape a buying decision inside an answer while its analytics report nothing, a problem we unpack in AI search attribution.
How often AI summaries appear, and what triggers them
Pew Research Center's browsing study tracked 68,879 real Google searches by 900 US adults in March 2025, and its trigger data is the most actionable table in this whole collection:
- 18% of all Google searches produced an AI summary, and 58% of people encountered at least one during the month.
- Question-format queries triggered a summary 60% of the time. Full-sentence searches triggered one 36% of the time.
- Length is the strongest signal: searches of ten or more words produced summaries 53% of the time, while one-to-two-word searches produced them just 8% of the time.
- The median summary ran 67 words, and 88% of summaries cited three or more sources.
Scope: real browsing behaviour by a US panel in March 2025, including navigational and one-word searches. This is the honest denominator, and it is why Pew's overall figure sits below tool-based coverage estimates.
Trigger rates by query intent
A second dataset cuts the same question by commercial intent rather than query shape, and the two together are more useful than either alone.
- Informational queries returned an AI Overview 36% of the time, commercial queries 8%, and transactional queries 5%, in Seer Interactive's analysis published April 2026.
- Comparison queries in "X vs Y" format returned one 95.4% of the time, the highest-exposure category in that dataset.
- The gap between informational and transactional exposure is roughly sevenfold.
Scope: 53 brands, 5.47 million tracked queries and 2.43 billion organic impressions, January 2025 to February 2026. This is a tracked keyword set assembled by SEO teams, so it skews informational by construction, which is exactly why its overall rate runs higher than Pew's.
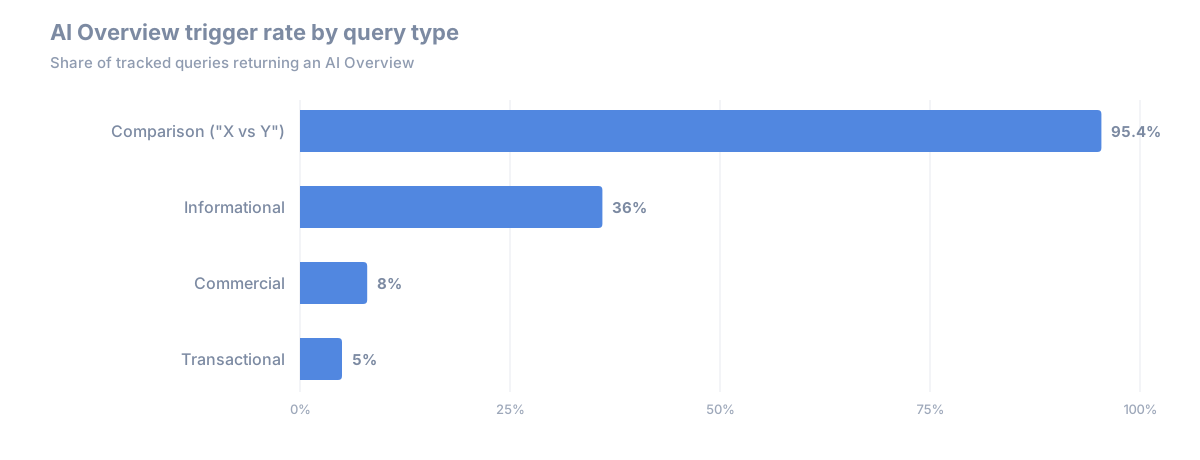
The two datasets are not in conflict, and the reconciliation matters: a buyer asking "what's the best CRM for a ten-person agency" is an informational query in a commercial context, which lands in the high-trigger bands of both studies. A buyer typing "salesforce pricing" is transactional and sits in the 5% band. Exposure is concentrated at the research stage, not the purchase stage. Full treatment in what triggers AI Overviews.
The pattern across both is unambiguous: the more a search looks like a question someone would ask a person, the more likely Google answers it directly. Since buyer research queries are exactly that shape, commercial visibility inside these answers is not optional. That same companion piece, what triggers Google AI Overviews, also explains why Seer's numbers and Pew's differ. How to show up in the answers is the subject of our AI Overviews and AI Mode guide.
What AI summaries do to clicks
- Organic CTR drops around 61% when an AI Overview is present, and paid CTR drops around 68%, according to Seer Interactive's study of 3,119 queries and more than 25 million impressions.
- Being cited inside the AI Overview softens the blow. The same Seer research measured roughly 35% more clicks for brands cited in the Overview than for those excluded from it.
- Pew's behavioral data agrees from the user side: people clicked a traditional result on 8% of visits when a summary was present versus 15% without one, and clicked a link inside the summary itself on just 1% of visits.
- Summaries end sessions. 26% of visits to a results page with an AI summary ended the browsing session right there, against 16% for pages without one.
Trade coverage of the CTR research is collected at Search Engine Land if you want the discussion around the data.
Who AI summaries cite
The same Pew study broke down where summary citations point, and the distribution explains a lot of GEO strategy:
- Wikipedia, YouTube, and Reddit together accounted for 15% of cited sources, the same three domains that dominate classic top results.
- Government sites took 6% of citations and news sites 5%, with the long remainder spread across the open web.
Two readings matter for brands. First, the citation economy has a head: a handful of high-trust platforms absorb a disproportionate share of slots, which is why presence on the third-party sources engines already trust often moves visibility faster than another page on your own domain. Second, the long tail is real: most citations point somewhere other than the giants, so well-structured pages that directly answer a question genuinely do get cited, the mechanism covered in what's a good AI citation rate.
Adoption: who is actually using AI chatbots
Pew's 2026 survey of Americans and AI puts hard numbers on how mainstream assistant usage has become:
- 49% of US adults use AI chatbots, up from 33% in 2024.
- 44% use ChatGPT specifically, more than double the 18% who used it in 2023.
- Among users, 24% use a chatbot daily, including 12% who use one several times a day.
- Age still splits adoption: 57% of adults under 50 use ChatGPT versus 28% of those 50 and over.
- The single most common use is searching for information, at 42% of users, ahead of work tasks (38% of employed users), entertainment (25%), and medical or fitness advice (20%).
That last number is the one to sit with: for nearly half of chatbot users, the assistant is already a search engine. Combined with the volume forecast below, it explains why measuring your presence in assistant answers stopped being experimental.
The volume shift
- Gartner predicted a 25% drop in traditional search engine volume by 2026, attributing the move to chatbots and virtual agents, in its widely cited February 2024 forecast. The prediction was aggressive and directionally right: search did not collapse, but question-shaped queries visibly migrated toward answer surfaces.
The research that started GEO
The original generative engine optimization paper (Aggarwal et al., KDD 2024) remains the most rigorous public experiment on what changes AI visibility. Its authors measured visibility improvements of up to 40% from content-side changes, with citations, quotations, and statistics performing best. That finding is the empirical backbone of most GEO advice worth following, ours included; see the complete GEO guide for how to apply it.
What 200 buyer prompts actually returned: our own study
Everything above comes from independent research. This section is different, and labeled as such: in August 2026 we ran our own study through the same measurement pipeline Citlyze uses in production, and we publish it here with its design attached so you can weigh it accordingly. The setup: 200 buyer-style prompts ("best X for Y", "A vs B", "alternatives to A") across 20 product categories, run once each through ChatGPT and Perplexity with web search enabled, plus a 30-prompt subset run five times each on ChatGPT to measure run-to-run variance. 520 answers total; one run per prompt supports the aggregate rates below, and only the five-run subset supports consistency claims.
- The engines almost never cite the same sources. For 77% of prompts, the domains ChatGPT cited and the domains Perplexity cited had zero overlap. Median overlap across all prompts was 0%.
- Perplexity cited Reddit in 77% of answers and YouTube in 68%. Those two figures count every source Perplexity's API returned with the answer; counting only the sources cited in the answer text, Reddit appeared in 13.5% and YouTube in 20%, and both fell further by late September, as the Q3 2026 citation index reports. ChatGPT's citation diet was tech and business media instead: TechRadar appeared in 12% of its answers, Forbes in 11.5%, G2 in 6.5%, with Reddit and YouTube barely present.
- Vendor-owned domains earned a minority of citations everywhere: 15.3% on ChatGPT, 3.9% on Perplexity. The rest went to third-party pages, which is the strongest number we have for why third-party presence beats another page on your own site.
- Answers name small consideration sets. The median answer named 3 to 4 of the tracked brands in its category, and the category leader appeared in 86% of ChatGPT answers and 81.5% of Perplexity's, a measurable incumbency advantage.
- Run-to-run variance is structural. In the five-run subset, only 68.8% of brands that appeared in at least one run appeared in all five, and not a single prompt returned the same citation list twice across five runs (median overlap between same-prompt citation sets: 4.8%).
Two scope notes: the runs went through each engine's API rather than its consumer app, with a single search pass per prompt, so app behavior can differ; and Google's AI surfaces were out of scope for this run.
How to read these numbers honestly
Five cautions keep this data useful:
- Every stat has a scope. Seer measured its own client dataset. Pew measured US adults on desktop-style browsing panels. SparkToro measured US clickstream panels. Extrapolate carefully to your market, and doubly so outside the US.
- The pace of change outruns publication. Engines redesign answer surfaces quarterly. The Pew behavioral data describes March 2025; AI Mode has expanded since. Treat any number older than a year as directional.
- Averages hide category variance. Informational queries went zero-click first; commercial queries are following at different speeds by vertical, and the two trigger-rate sections above are the best available proxy for how exposed your query mix is.
- Populations differ, so numbers that look contradictory often are not. Panel studies of real browsing and studies of tracked keyword sets measure different query mixes. Before comparing two coverage figures, check whether they counted the same kind of search. Averaging them produces a number describing nobody.
- Vendor studies deserve extra scrutiny. Companies selling AI visibility tools (ours included) have incentives. That is why the load-bearing numbers on this page come from research firms, analysts, and academic work, and why our own study above ships with its full design stated, so you can discount it exactly as much as it deserves.
None of this says traditional search is dying. It is shrinking and changing shape: retrieval still runs on search infrastructure, and buyers still click when answers are insufficient. The work is showing up in both places. What that split looks like over the next few years is argued, with a falsifiable prediction attached, in the future of SEO.
Using these statistics
Every heading on this page is linkable, so you can point at a single statistic rather than the whole article. Two requests if you cite something from here.
Cite the primary source too. Pew, Seer, SparkToro, Gartner, and the GEO paper did the work; we collected it. Each is linked inline at the point of use.
Carry the scope with the number. A statistic without its population and date is how a US desktop panel finding becomes a claim about global search. The scope lines exist to travel with the figure.
If a number here goes stale or a study is superseded, we would rather hear about it than keep publishing it.
Turn the trend into your own numbers
Industry statistics tell you the water is rising. They cannot tell you whether your brand appears when your buyers ask. Citlyze measures your actual mention and citation rates across ChatGPT, Gemini, Perplexity, and Google's AI surfaces, so your strategy runs on your data. See how the platform works.